

Full visibility for management
Sales, deal value, team, campaign and inventory performance in one place.
Real Estate Data Analytics
Every KPI in one live dashboard, ready to export.
Marketing
where your best customers come from
Lead journey
from first contact to signature
Team
how each agent performs
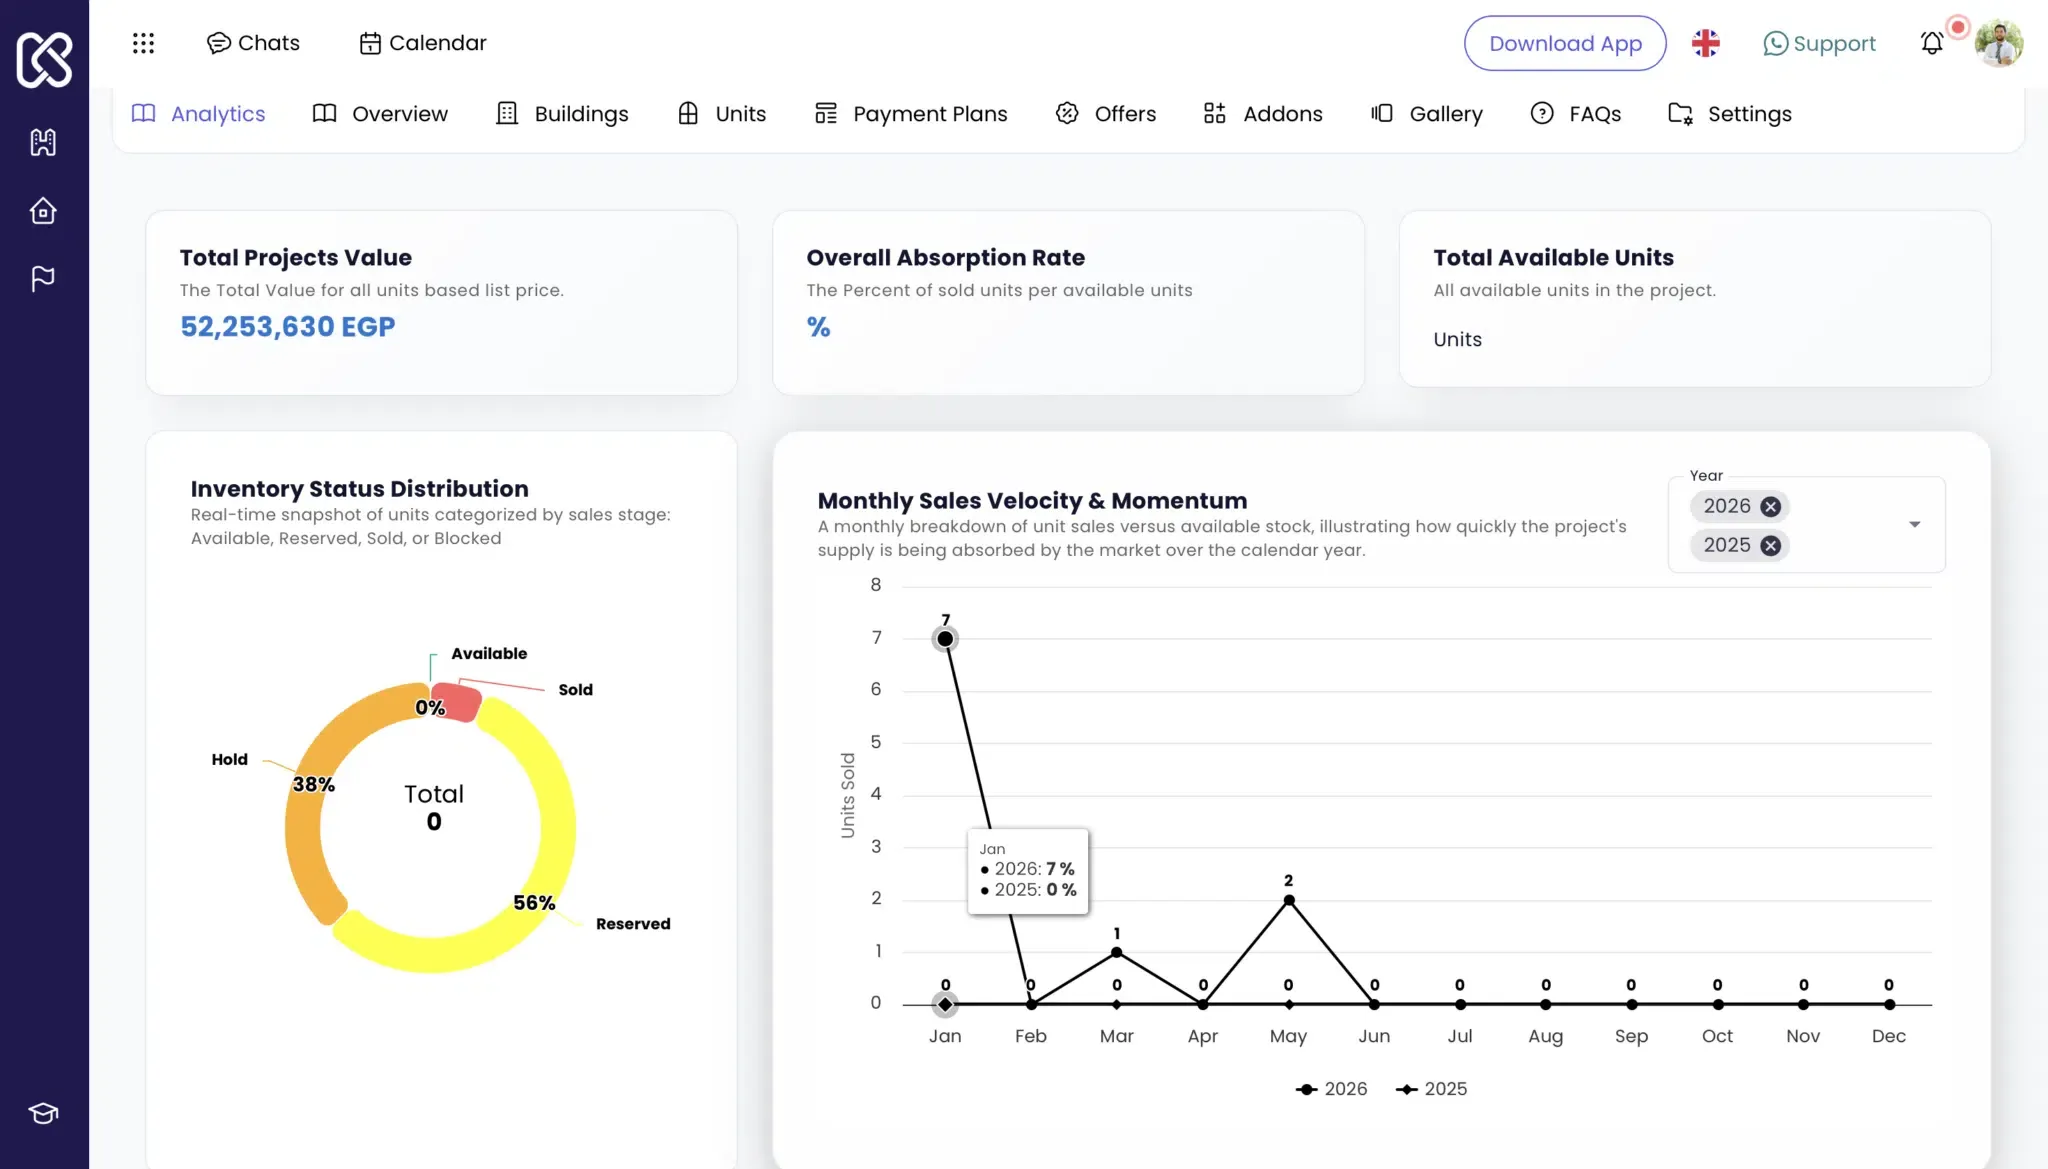
Inventory
which units move and which stall
Marketing Analytics
Compare channels and campaigns by cost per lead and real conversion.
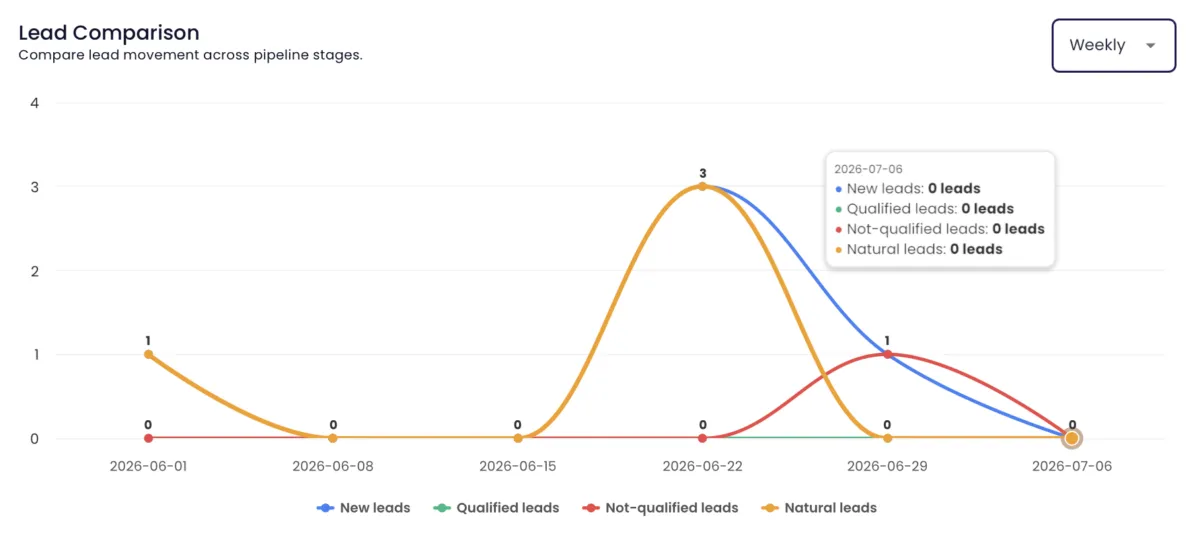
Know where your best customers come from… and invest your budget where it counts Every dollar you spend on ads deserves to have its return measured. Kords gives you precise visibility into the performance of every marketing channel and every campaign individually — from lead volume, to cost per lead (CPL), down to the actual conversion rate of each source. Discover which platforms bring you real deals and which ones drain your budget with nothing to show for it, then reallocate your spend with confidence backed by numbers.
Lead Journey Analytics
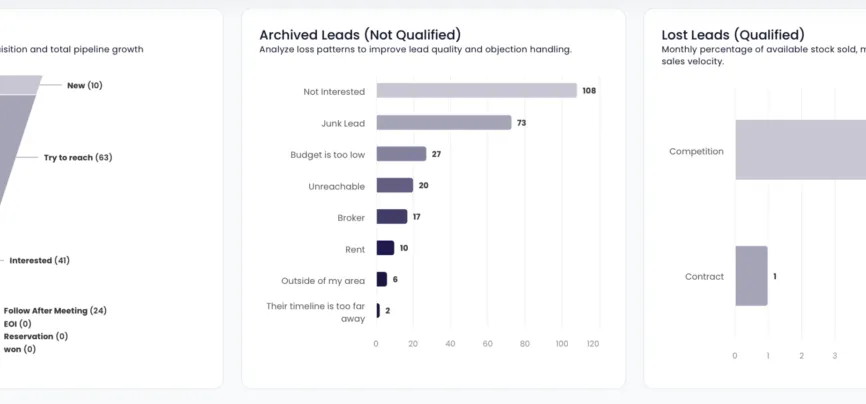
See where deals stall and how long leads stay at each stage.
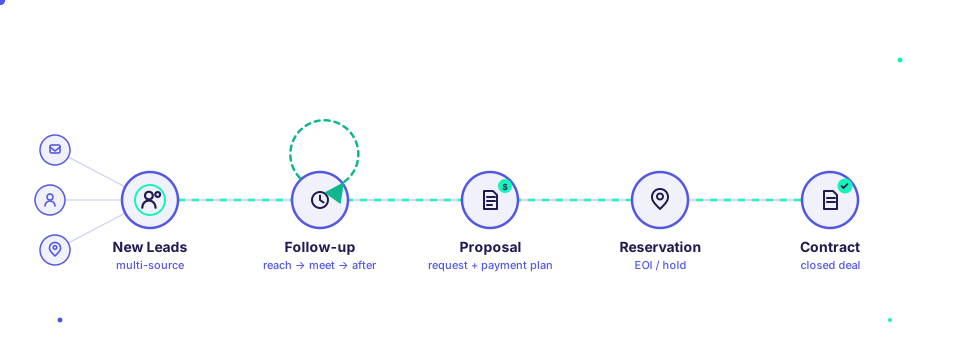
Track every lead from first contact… to the moment they sign Understanding a lead's journey through the sales funnel is the difference between a closed deal and a lost one. Kords shows you a complete breakdown of how leads move between sales stages, the conversion rate from one stage to the next, and the average time a lead spends at each stage. Discover exactly where your leads get stuck (bottlenecks), why some deals stall, and which stages need fast intervention before you lose the client.
Agent Performance
Measure every agent on clear criteria: response, activity and closing.
Know who makes the difference on your team… with numbers, not impressions Measure every team member's performance with clear, fair criteria. Kords gives you a detailed performance dashboard for every sales agent, covering the number of leads managed, response speed to first contact, number of activities (calls, meetings, viewings), and conversion and closing rates. Identify strengths to reinforce, spot who needs coaching or support, and route new leads to your most effective agents to lift the company's overall results.
Inventory Performance
Know your fast and stagnant units before you decide on pricing and launches.
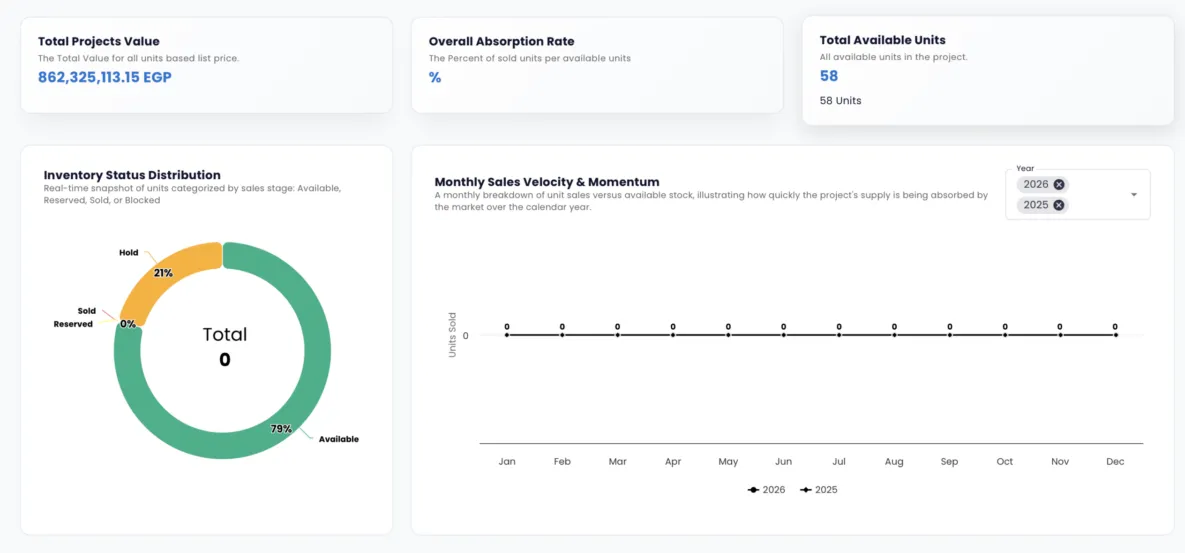
Know which units are moving fast… and which need a decision Your real estate inventory isn't just numbers — it's a signal of your project's health. Kords reveals sales rates for every project and phase, your fastest-selling units and models, and the stagnant units that need a pricing or marketing review. Connect actual customer demand with your available supply, and make pricing and launch decisions at the right time, backed by market data inside your own system.
What you get
A live, complete view of business health — filtered and exported in a click.
Sales, deal value, team, campaign and inventory performance in one place.
Ready to share in management meetings with one click.
By period, project or team.
Numbers update with every activity inside the system.
How it works
Pick the period, project or team you want to see.
Watch live indicators for sales, teams, campaigns and inventory.
Export the report and take it to your management meeting.




Stop running your company on gut feeling. See where you win, where you lose, and where the next opportunity is.